Haiku Statistics

Some months ago I started to learn programming with Python, but i don’t really like the pre-made programming courses, so I thought I’ll be more motivated, if I try to solve a problem, what interesting for me. I slept some, and i came up with the following idea: there are some voices about the death of my favorite project what I’m following in the last 14 Years. It is the Haiku Project.
What is Haiku?
HAIKU is an open source operating system currently in development. Specifically targeting personal computing, Haiku is a fast, efficient, simple to use, easy to learn, and yet very powerful system for computer users of all levels. Additionally, Haiku offers something over other open source platforms which is quite unique: The project consists of a single team writing everything from the kernel, drivers, userland services, tool kit, and graphics stack to the included desktop applications and preflets. While numerous open source projects are utilized in Haiku, they are integrated seamlessly. This allows Haiku to achieve a level of consistency that provides many conveniences, and is truly enjoyable to use by both end-users and developers alike.
I had an idea: it is not enough to say, the project is dying. If it is so, i must to show somehow. So i tinkered a bit about this task, and made a conclusion: it is a voluntary project, and everybody can see the GIT statistics. But only the changes in the source tree can’t show us, what’s going on, we need to see, what’s going on in the community, because it is also matters. So i made a program to collect the data about the activity of our community.
The Haiku Project have some Mailing lists, the two most popular are the Haiku General Mailing List and the Main Development List. So my program downloaded all the mail archives, and counted the mails, what the developers and users sent to the lists. It was pretty easy. But the project have an IRC channel too on Freenode, so I wrote a module, what downloaded all the IRC archive, and counted all the comments. It was a bit hard, but i came up with a solution, so i got the data. I wanted to show, what’s going on, so I made a nice chart, and made a markers for the previously releases. Here is it:
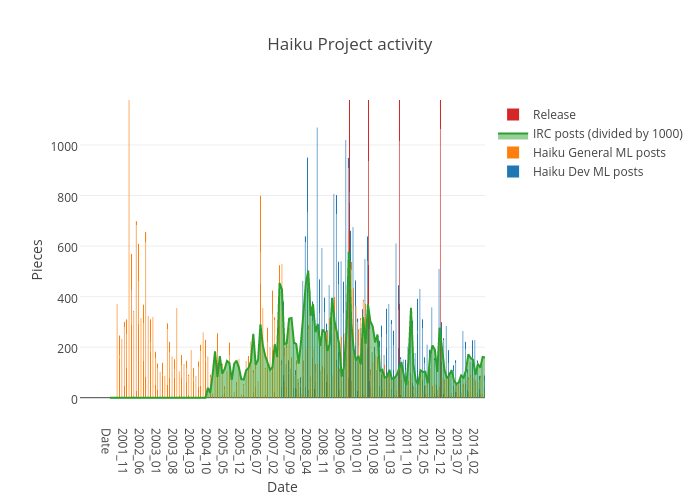
As you can see, the green area is the IRC channel activity, the orange and blue bars are the General and Development Mailing list activity respectfully.
But i wasn’t able to stop, so i collected the data about the donations, to see, when and how many donation the project got, and here is it:
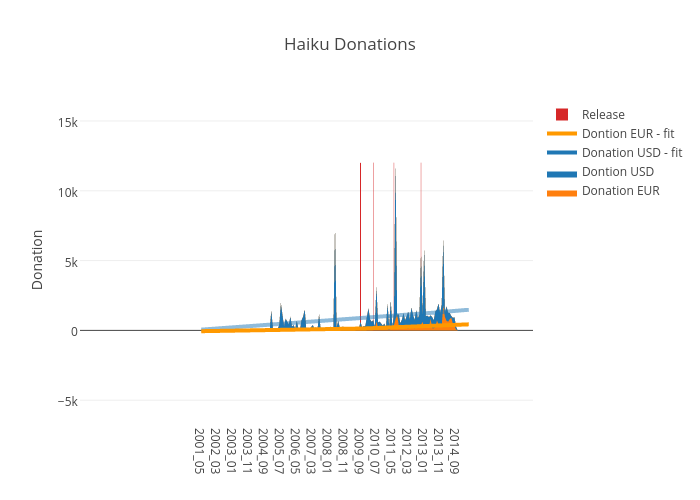
As you can see, the orange area shows the EUR, while the blue one the USD donations respectfully. And of course, the bars are the release dates from R1Alpha1 till R1Alpha4.
I’ll try to keep the charts up to date in the future.
Thats all for now folks.